A New Estimate for Single-Family Rental Construction

- Quarterly U.S. Census Bureau data underrepresent single-family rentals (SFR) due to the inability to track build-for-rent (BFR) properties.
- Build-to-rent (BTR) and BFR accounted for 4.4% and 3.4% of single-family construction starts in 2019, respectively, according to new Chandan Economics estimates.
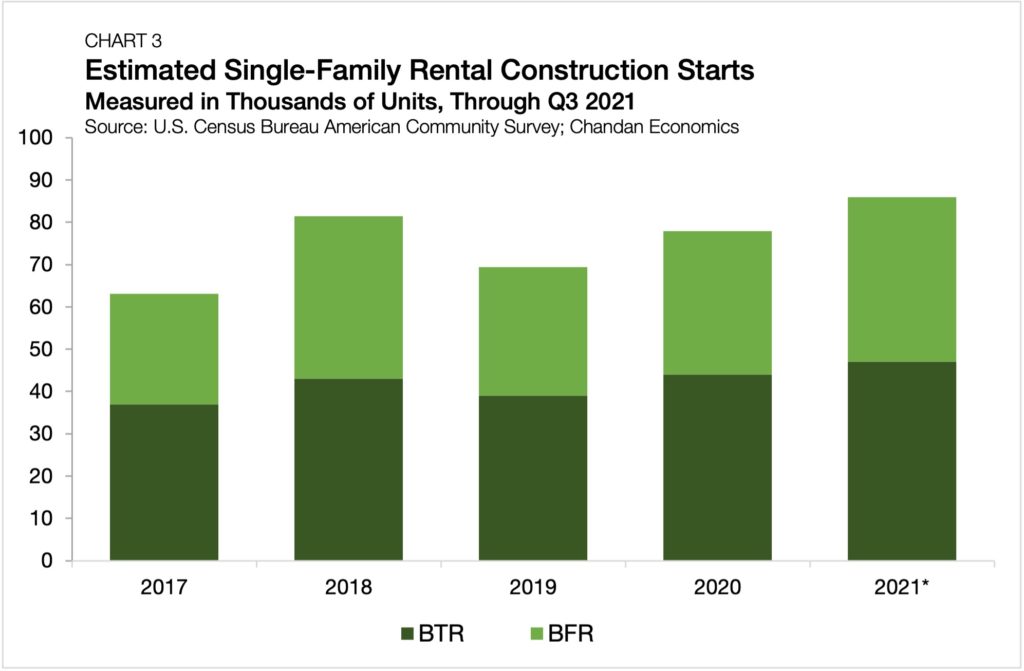
- Based on our findings, single-family construction starts totaled 86,000 (47,000 BTR and 39,000 BFR units) as of the year ending in the third quarter of 2021.
Key Findings
In recent years, the single-family rental (SFR) sector has catapulted into an institutionally viable asset class due to strong investor appetites, a growing need for affordable suburban housing options and improvements in property management software. With the SFR sector evolving so quickly, there are some gaps in data availability compared to other sectors, namely multifamily. This data gap is most apparent when tracking the supply of new single-family rental construction, a market-standard metric.
In this research brief, the Chandan Economics and Arbor Realty Trust teams offer a new framework to estimate the volume of new SFR housing units under development. Our findings below suggest as many as 86,000 SFR housing units have started construction in the year ending in third quarter of 2021.
SFR’s Market Share
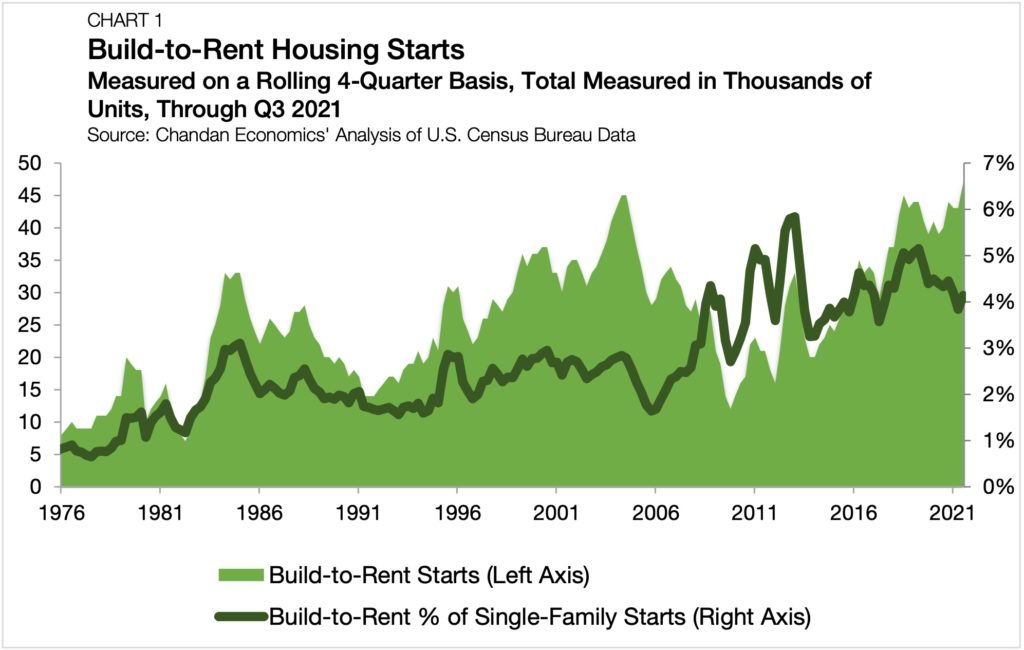
Each quarter, Chandan Economics and Arbor provide an estimate for build-to-rent (BTR) construction starts, calculated using the Census Bureau’s Survey of New Residential Construction. Based on this measurement, construction started on an estimated 47,000 BTR units for the year ending in the third quarter of 2021, accounting for 3.5% of all single-family construction (Chart 1).[1]
While these data reflect a market that is rapidly growing, they also underreport the SFR sector’s share of new construction.

The underreporting comes from what is not reported by the Census Bureau quarterly survey. We currently track SFR units in which the developer and the operator are the same entity (build-to-rent or BTR units). However, using these quarterly data, we can’t track single-family homes a developer builds for the purpose of selling to a single-family rental operator (build-for-rent or BFR).
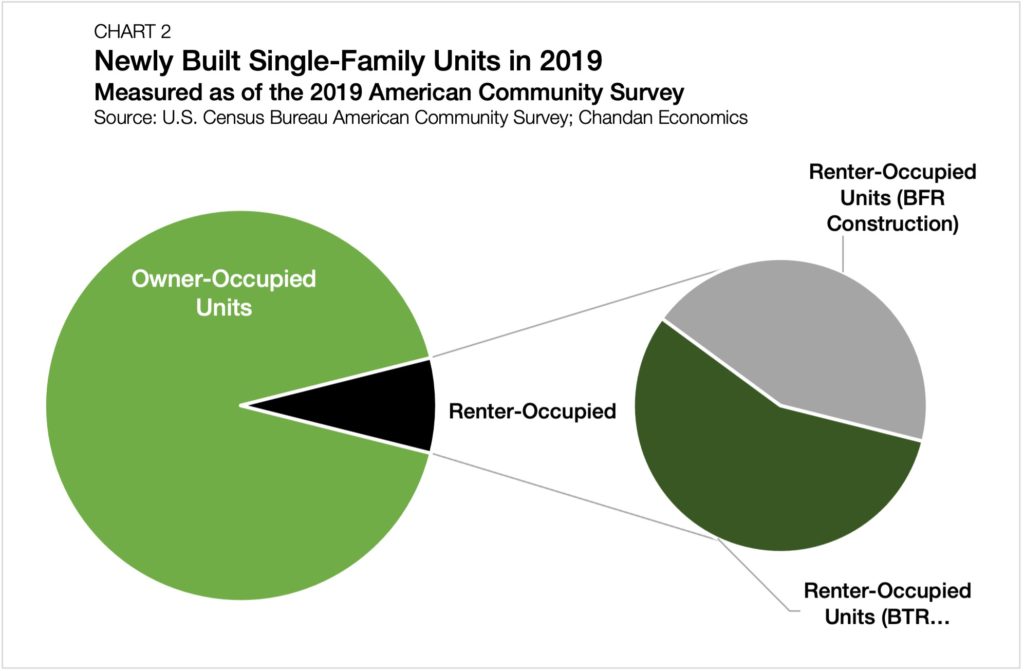
Utilizing a secondary source, the Census Bureau’s American Community Survey (ACS), we can estimate the percent of recently built single-family homes that are renter households.[2] By comparing the rental share of new single-family construction in the ACS against the BTR share from the quarterly construction starts data, we can infer that BFR makes up the balance between the two figures:
SFR % – BTR % = BFR %
According to the 2019 ACS, the rental share of occupied, newly built single-family housing units was 7.8%. Looking at the 2019 construction starts data, BTR accounted for 4.4% of all new single-family starts in that year. Taking the difference between these two figures, we estimate BFR accounted for 3.4% of new construction (Chart 2).

Volume of Single-Family Rental Construction Starts
In 2019, 888,000 single-family housing units began construction. Of these, an estimated 39,000 single-family housing units were BTR single-family rentals.
Applying our new BFR share of single-family housing units under construction estimate (3.4%) to 2019’s single-family start totals, we measure BFR as an additional 30,000 units.[3] Aggregating the BTR data with our new estimate of BFR suggests that 2019’s combined SFR construction start total was 69,000 — 78% higher than the build-to-rent estimate taken alone.
When applying this methodology to recent years, we find that in 2017 and 2018, BFR accounted for 3.1% and 4.4% of new construction, respectively. While ACS data are not yet available for 2020 and 2021, we apply the most recent estimate (2019) on a forward basis. Notably, we expect the 2019 BFR estimate of 3.4% may still be conservative, given the growing popularity of the product type and development strategy.
In this model, the 2020 estimate for BFR construction starts totaled 34,000, bringing the sum of SFR starts last year up to 78,000. In the year ending in the third quarter of 2021, the total is even higher, notching up to 39,000 BFR starts, bringing the combined SFR total to 86,000 starts (Chart 3).

About the Methodology
The methodology laid out in this exercise considers data lags and the challenge of aggregating multiple sources. However, it is reasonable to suggest it represents an improvement on the existing market standard. By including an applied BFR estimate, the third-quarter 2021 SFR construction start total rises by 83% above the BTR starts figure alone.
Given the importance of timely construction data to the SFR industry, and the scale of underreporting using just the Census Bureau’s quarterly data, improved data coverage for the sector could be on the horizon. In the meantime, these data confirm what most market participants already knew to be true: single-family rental construction has grown into a significant category of its own.
[1] Chandan Economics estimates build-to-rent single-family rental starts by taking the difference between all single-family housing starts and the sum of single-family housing starts for sale, contractor-built single-family housing starts and owner-built single-family housing starts.
[2] For this analysis, Chandan Economics considers “recently built” or “newly built” single-family homes in each observation year to include properties constructed either in the observation year or the year prior. In the 2019 American Community Survey, we consider properties built in 2018 and 2019 to be new construction.
[3] For consistency with U.S. Census Bureau construction starts reporting, all calculated data are rounded to the nearest thousand.

